In previous posts, I’ve shown you how I use Excel to track my own writing sessions, and discussed why opening and closing routines are crucial to sustained writing. In this post, I put all three pieces together by showing you how to make an “opening routine” Google Form you will use to check in to each writing session, a “closing routine” Google Form you will use to check out, and a tracking spreadsheet that automatically calculates what you’ve done.
The Opening Routine Form
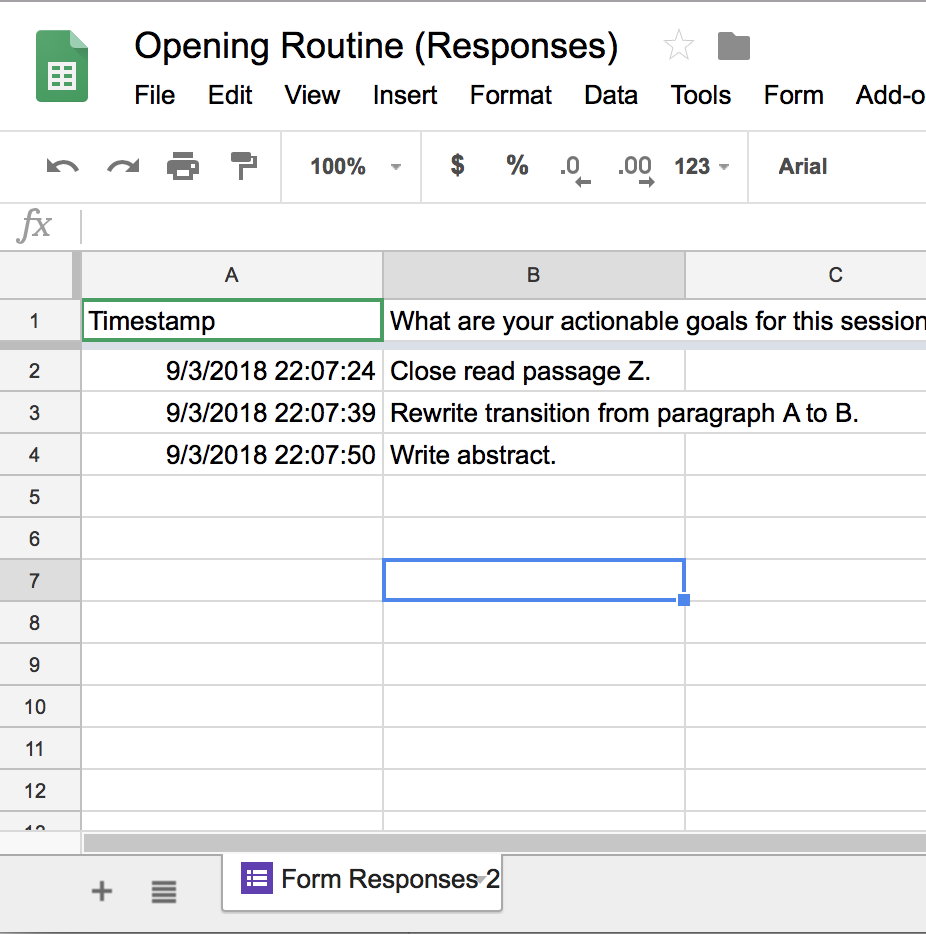
In many ways, using Google Forms are easier than an Excel spreadsheet because each response is automatically timestamped. I’ll show you why this is amazing below. But, for now this means that you don’t need to enter date and time. All your opening routine form needs is a spot for you to type in your actionable session goals, like this:

Enter those, click “submit,” and get writing!
Don’t know how to set up Google Forms? No worries!
Download your own copy to your Google Drive.
Once you download it, it’s your own private copy–I won’t see anything, and you can edit it as you please.
How to Fill Out Your Opening Routine Form
Once you have your own copy of the Opening Routine Form in your Google Drive, click on the “Send” button in the upper right-hand corner.

Then, click on the link icon to get your own form URL.
If you’d like, you can get a “short” URL by clicking on the “shorten URL” checkbox.

Copy the URL by highlighting it and clicking Command (or Control) + C, or clicking on the “copy” button.

Now, save the URL somewhere. Or, you can paste it into your browser’s address bar and bookmark it, since you’ll be using it frequently.
Your Closing Routine Form
Here, you will likely want to customize your form to reflect what variables you want to track over time. But, as I discovered first hand, trying to measure every single variable possible is a recipe for disaster. So, especially if you’re starting out, keep things simple. Track what you accomplished, how easily you started, your focus, and your actionable goals for your next session.

If you want to better understand your own challenges, you can also create a field for that.
Download your own copy to your Google Drive, where you can edit it to fit your needs!
How to Fill Out Your Closing Routine Form
Follow the instructions for “how to fill out your opening routine form” above.
See Your Responses
You can see all your responses by opening your Google Drive or going to forms.google.com, which is where you can see all your Google Forms, specifically.

Click on the form you want to open, which will open the “editor” pane. Here, you can change the form (add/change questions, create sections, etc.). But you can also see your responses by clicking “Responses.”

There, you’ll be able to see all your responses. But you’ll also be able to set it up to send its data directly to a “linked” Google Sheet. Click on the three dots in the upper right-hand corner to set this up.

Click “Select Response Destination” from the menu.

Then select “Create a New Spreadsheet” and click “Create.”

Setting Up Your Magic Tracking Spreadsheet
This is where the Google Form method is really amazing. Head back to your Google Drive, and locate the spreadsheet you just created. Right now, it doesn’t look like much. But in a few minutes, it will give you some interesting data.
You’ll notice that your sheet’s tab says “Form Responses,” and that a timestamp column has magically appeared. This is how you’re going to get your date and time information.
Now, go back to your Google Drive and locate your closing routine form.
Click on “Responses” and the three dots to select a response destination. But this time, do not “create a new spreadsheet.” Instead, you will “select existing spreadsheet” and click “select.”

Choose the same spreadsheet where your first form’s data is being sent.

Now, open the spreadsheet again, and you should see two tabs–one for each “linked” form.

Now, you’re going to click on the “+” to create a new tab for your tracking spreadsheet. Name it whatever you’d like.
Create the following columns:
- Date
- Check Date (this is to make sure that your responses are matched up)
- Day
- Week
- Start
- End
- Focus
- Start
- Time Elapsed
- Mins Elapsed
How to Set up Your Spreadsheet Formulae
This section will walk you through setting up formulae to automatically pull data from your form response sheets. In the formulae, I assume that:
- Your “opening routine” data is on a sheet titled “Form Responses 1“
- Your “closing routine” data is on a sheet titled “Form Responses 2“
- The columns in your tracking sheet are arranged as I outlined above
If any of those assumptions does not match your spreadsheet, you will need to update your formulae accordingly.
There are other ways to set up your formulae that work, but the ones I will show you below are set up so that you will never have to “drag” the formulae down for data to populate. Many thanks to a boot camper who showed me how to do this better than my original solution!!!
Date
In cell A2, type the following formula:
=ARRAYFORMULA(‘Form Responses 1’!A2:A)
Check Date
In B2, type the following formula:
=ARRAYFORMULA(‘Form Responses 2’!A2:A)
You want these to be dates, though, not dates and times, so select the cell, and click on “Format” above.

Then, select “Number” and “Date” from the drop-down menu.

Note: If these are NOT the same, then your rows from your Google Form-linked spreadsheets are off. Either you did a closing routine but not an opening one, or you did an opening routine but not a closing one. Delete the data from those forms to sync them up or add a new row to the form that’s missing a day.
Day
This is handy so that you can see how your writing time, focus, etc. varies by day.
=ARRAYFORMULA(IF(ISBLANK(A2:A),””,TEXT(A2:A,”dddd”)))
You should now see the day of the week printed.
Week
This is handy so that you can see how much time you’ve spent in a week, and compare weeks to each other.
=ARRAYFORMULA(IF(ISBLANK(A2:A),””,WEEKNUM(A2:A)))
The result should be a number between 0 and 52.
Start
This will turn the timestamp of when you submit your opening routine into your “start time.”
=ARRAYFORMULA(IF(ISBLANK(A2:A),””,TEXT(‘Form Responses 1’!A2:A,”hh:mm”)))
This should print a 24-hour time.
End Time
Same as start time, except replace your opening routine timestamp with your closing routine timestamp.
=ARRAYFORMULA(IF(ISBLANK(A2:A),””,TEXT(‘Form Responses 2’!A2:A,”hh:mm”)))
Focus
This will allow you to see how your focus varies over time. Are you consistently more focused on Mondays? In the afternoon?
=ARRAYFORMULA(‘Form Responses 2’!D2:D)
Start
This will allow you to see how the effort it takes you to start varies over time. Do you start more easily in the morning?
=ARRAYFORMULA(‘Form Responses 2’!C2:C)
Time Elapsed
This will allow you to see how much time you’ve spent in each session. Use this formula template:
=ARRAYFORMULA(IF(ISBLANK(A2:A),””,F2:F-E2:E))
Minutes Elapsed
This will allow you to see how many minutes you’ve spent per session. If you’ve set your sheet up the same as mine, you should be able to use the following formula:
=ARRAYFORMULA(IF(ISBLANK(A2:A),””,(F2:F-E2:E)*1440))
Data Trends and Analytics
Using the above data (pulled from your Google Forms), you can also see some basic trends.
First, create a simple table that matches this one:
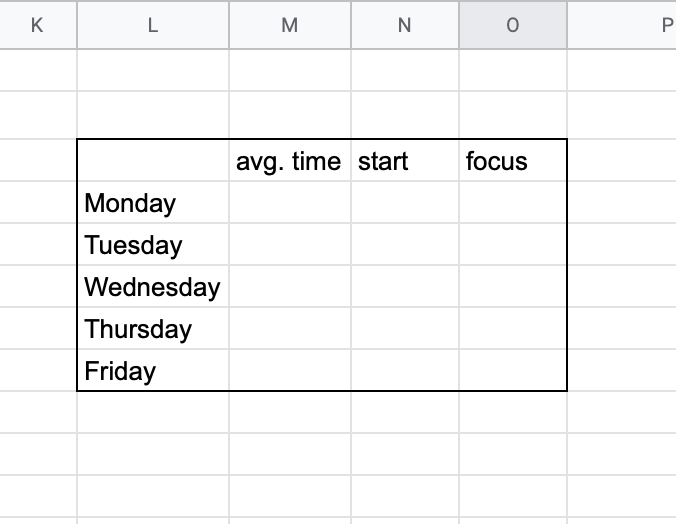
See how many minutes you average on the different days of the week.
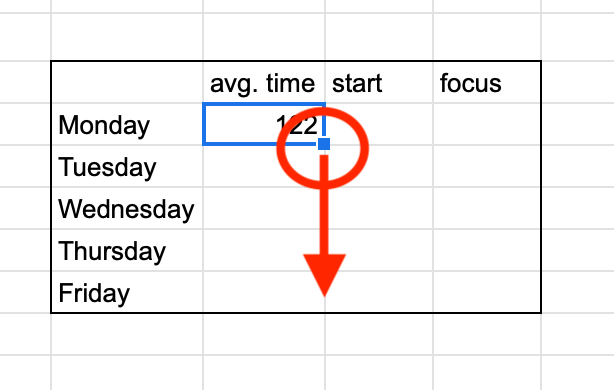
To do this, use the “AVERAGEIF” formula.
=AVERAGEIF(C:C,L4,J:J)
Note that in this example, the word “Monday” appears in the cell L4. If your “Monday” is in a different cell, replace L4 with that cell. You can drag that formula down to fill it in the other cells.
If that doesn’t work, the following formula will:
=AVERAGEIF(C:C,”Monday”,J:J)
Note that if you use this formula, you can drag down, but you will need to manually replace “Monday” with “Tuesday,” etc.
See how focused you are on a given day.
Here again, use the “AVERAGEIF” formula. If you’ve set your sheet up the same as mine, use this formula:
=AVERAGEIF(C:C,L4,G:G)
Again, you can replace “L4” with the cell that contains the word “Monday.” You can use the same process to calculate average focus.
See how many times you’ve written on any given day.
To do this, use the “COUNTIF” formula.
If you’ve set your sheet up the same as mine, use the formula:
=COUNTIF(C:C,”L4″)
This should tell you how many times overall you’ve written on Mondays.
See how many hours you’ve racked up per week.
To do this, first type the week numbers–starting with the number in your cell D2 in a column. This table starts with “25” because that is the first week in this spreadsheet’s D2 cell.

Now, we’ll use the SUMIF formula:
=SUMIF(D:D,Q3,J:J)/60
In mine, the week number “25” is in cell Q3; replace this value with yours if necessary. You should be able to fill this formula down.
If that does not work, you can always use the formula:
=SUMIF(D:D,”25″,J:J)/60
You will need to manually change “25” to the correct weeks in each cell.
See How Many Times You’ve Written Each Week
In this case, you will use the “COUNTIF” formula.
=COUNTIF(D:D,Q3)
If your first week number is in a cell other than Q3, then replace that value with the correct one for your sheet.
Visualize Changes Over Time
Of course, now that you have some basic data, you can also plot it over time using charts. For instance, you can plot a simple graph of your hours per week and add in a trend line.

Watch Your Sessions Add Up
You can also set goals for yourself and see how the small chunks of time add up in the long run. Let’s say you set a goal of writing 180 hours this summer.
Create a table similar to this one:

In the cell next to “goal hours” cell, type your goal. In the cell next to “total hours”, type the formula:
=SUM(J:J)/60
Then, make a chart out of that data, and watch the “total hours” bar approach the “goal hours” one over time.

Your Turn
What trends are you most interested in tracking for yourself?
Let me know what questions you have in the comments below!
Thanks, this is really great and I am going to give it a go.
This looks like the tool I am searching since ages. I have tried Google sheets before but I am not much familiar with formulas so failed to add analytics.
I have also tried writeometer but I hate picking up the distracting dragon as it kills the whatever mood and energy I have left for writing.
There are other sites that allows you to keep track of writing but the advance analytics is at the premium rate.
I hope my search will end now.
Pingback: The 7 Stages of Publishing Your First Academic Book, Challenges & Tips